The Situation
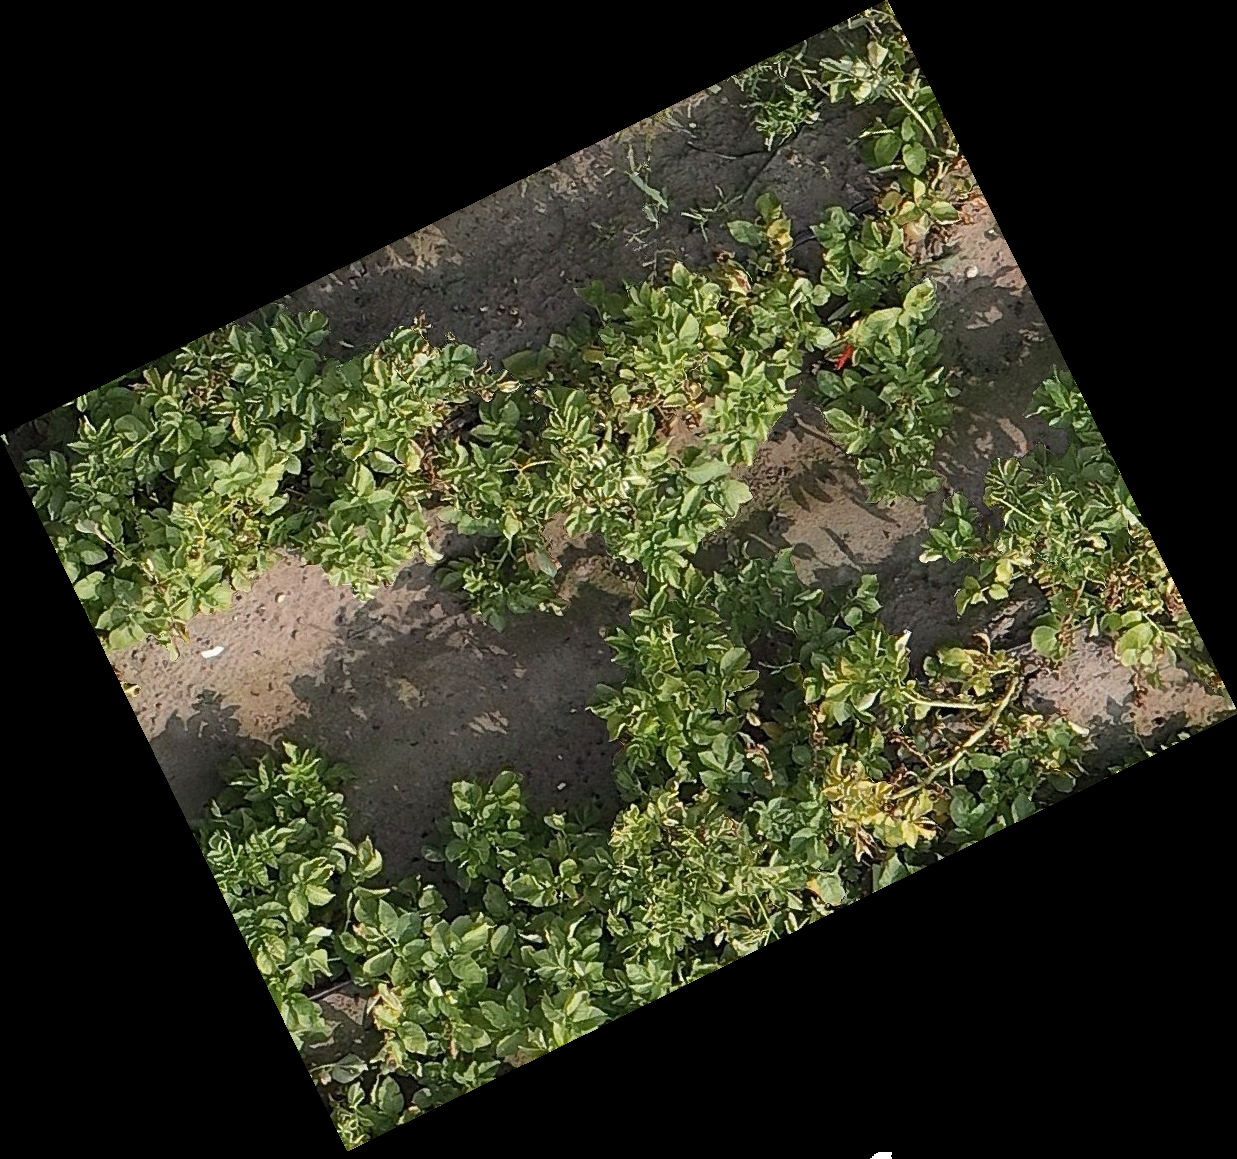
The canopy cover pipeline was already running, weekly flights, per-plot percentages, automated CSV delivery. But canopy cover on its own tells you how much of the soil is shaded, not how the crop is growing vertically or whether it is under thermal stress. Two more traits were needed: canopy height and temperature, the most useful for distinguishing vigour differences between varieties early in the season.
The challenge was calibration. Height from a drone is relative to whatever the sensor happens to be flying above, in a ridged potato field, the soil baseline itself varies by centimetres between plots. And raw thermal pixel values are instrument readings, not actual temperatures, until they are anchored to a physical reference.
The Approach
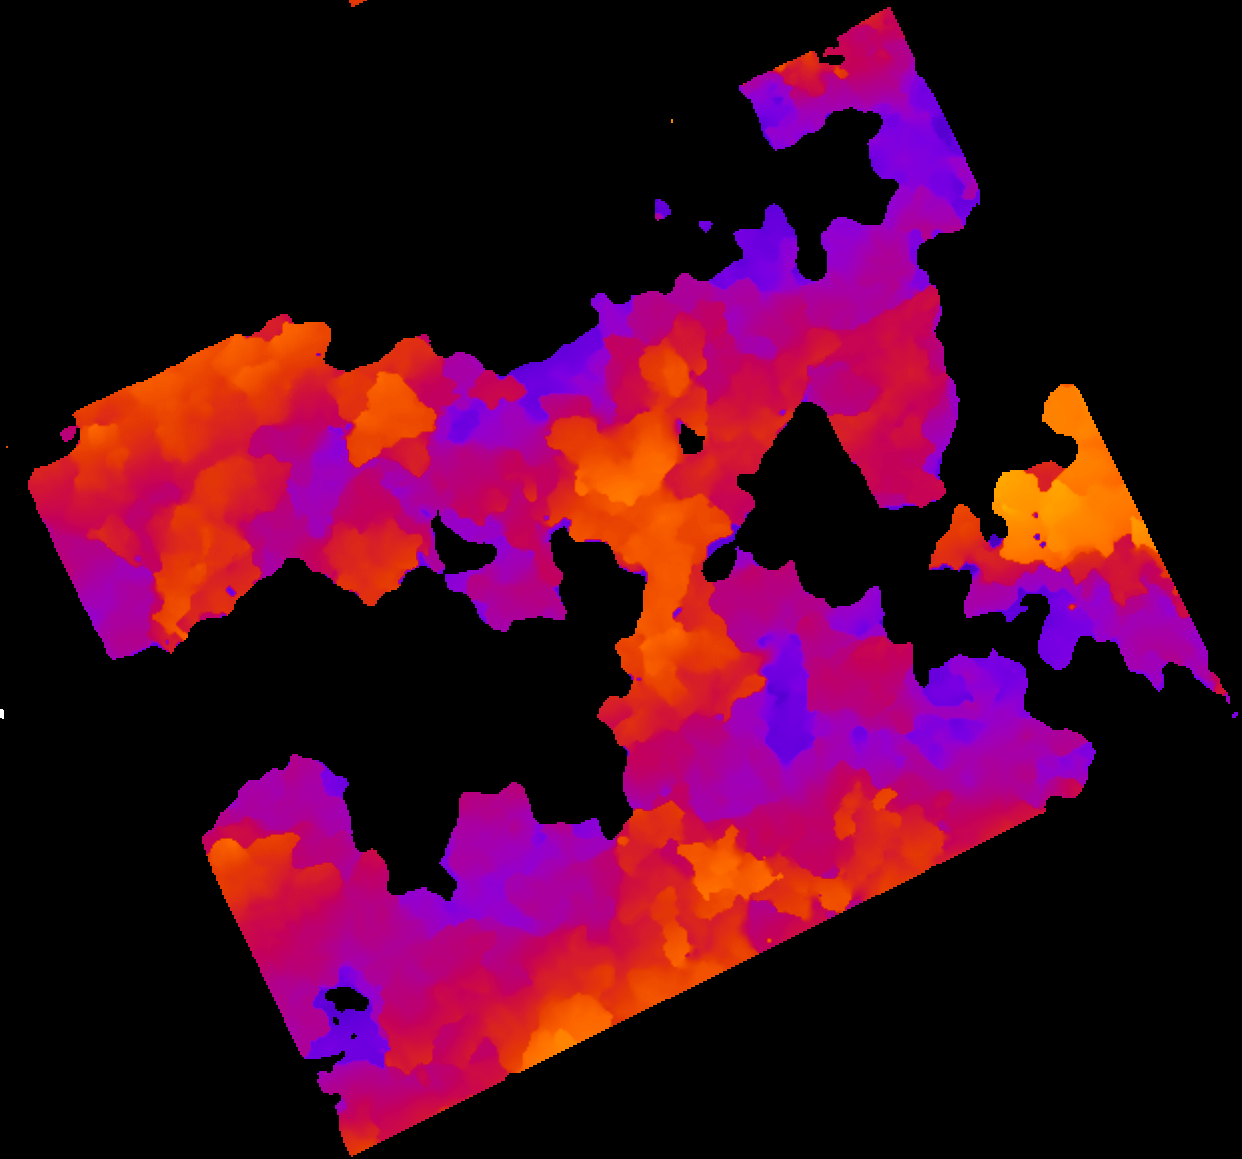
For height, we process the RGB imagery through Agisoft Metashape to produce a dense digital elevation model (DEM) of the whole trial area. Ground control points placed before the flight provide absolute GPS coordinates that anchor the model. Pre-emergence images, captured before the crop breaks the surface, establish the bare-soil ridge height at each plot. Subtracting that baseline from the vegetated DEM yields true canopy height above the ridge, correcting for the uneven terrain across the field.
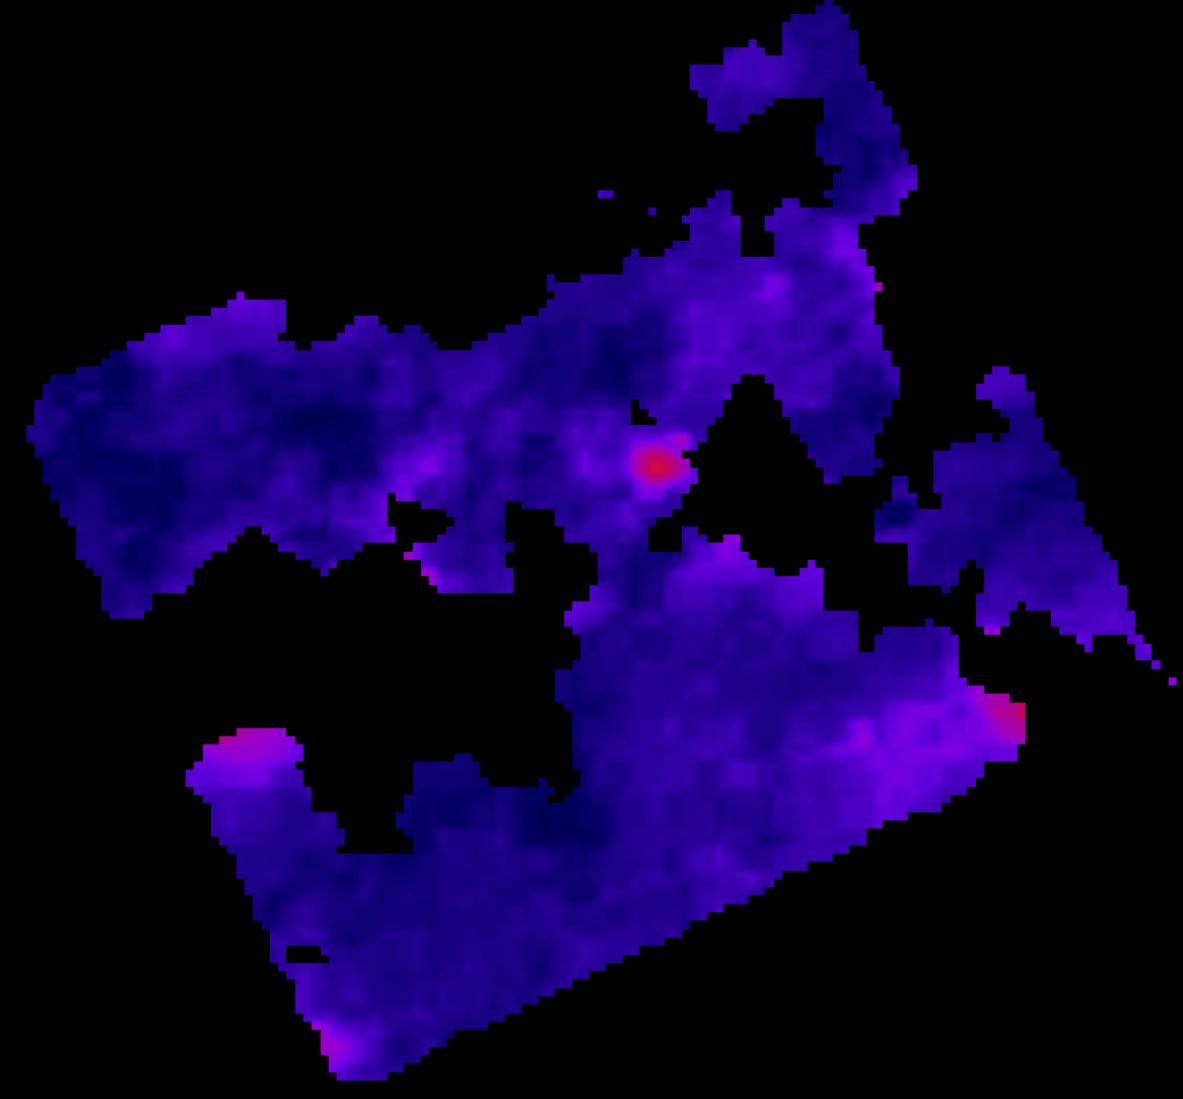
For temperature, the drone carries a FLIR thermal sensor alongside the RGB camera. Painted aluminium reference targets placed in the field at known temperatures anchor the thermal orthomosaic to physical Celsius values through a linear calibration. The canopy segmentation mask from the coverage pipeline is then applied to both the DEM and the thermal layer, stripping soil pixels before computing plot averages, so the output reflects canopy temperature and height rather than a mixture of canopy and bare ground.
The Result
Each flight now produces three numbers per plot per date: cover percentage, mean canopy height, and mean canopy temperature. The thermal channel resolves a range from approximately 15°C early in the season to over 40°C during heat events, with enough sensitivity to distinguish stressed from non-stressed plots on the same flight day.
Because the height and temperature layers share the same plot boundaries and coordinate system as the coverage data, all three traits sit in a single joined table, no manual alignment, no data wrangling between sensor outputs. The workload per flight date remained the same; the information yield tripled.